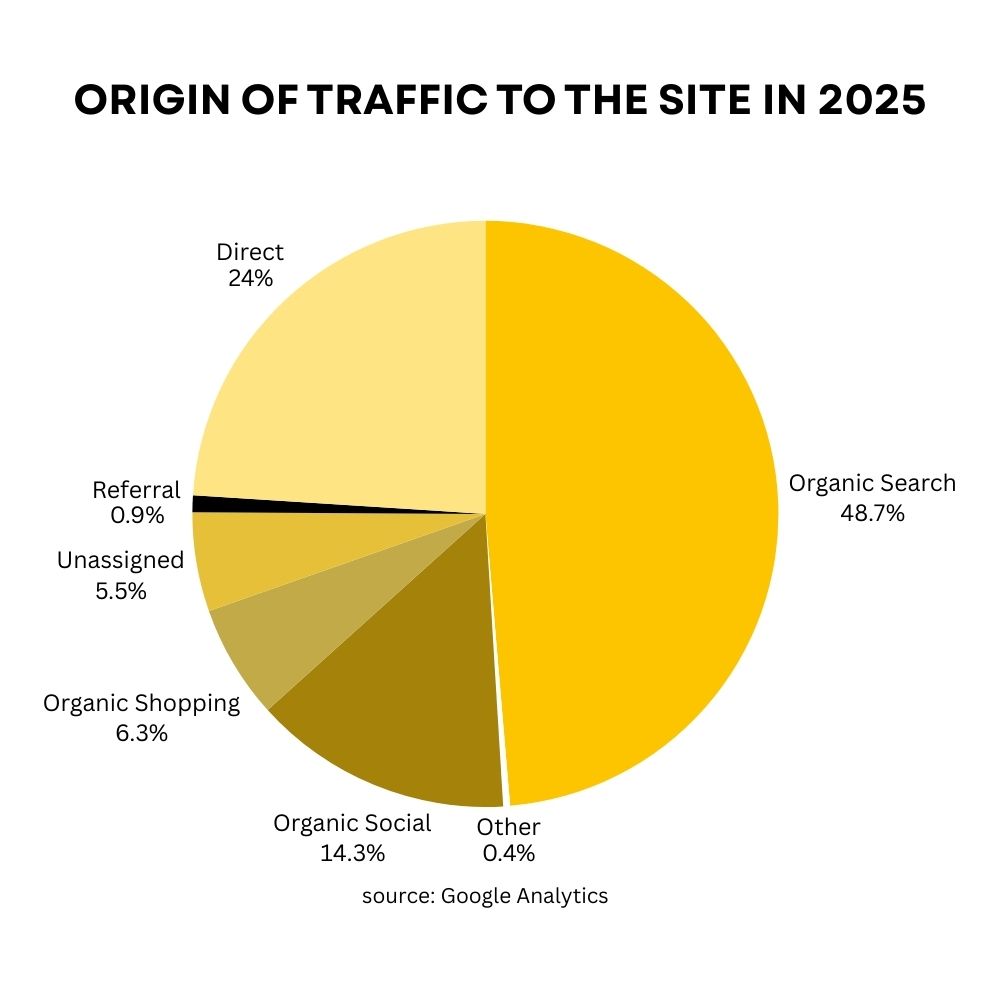
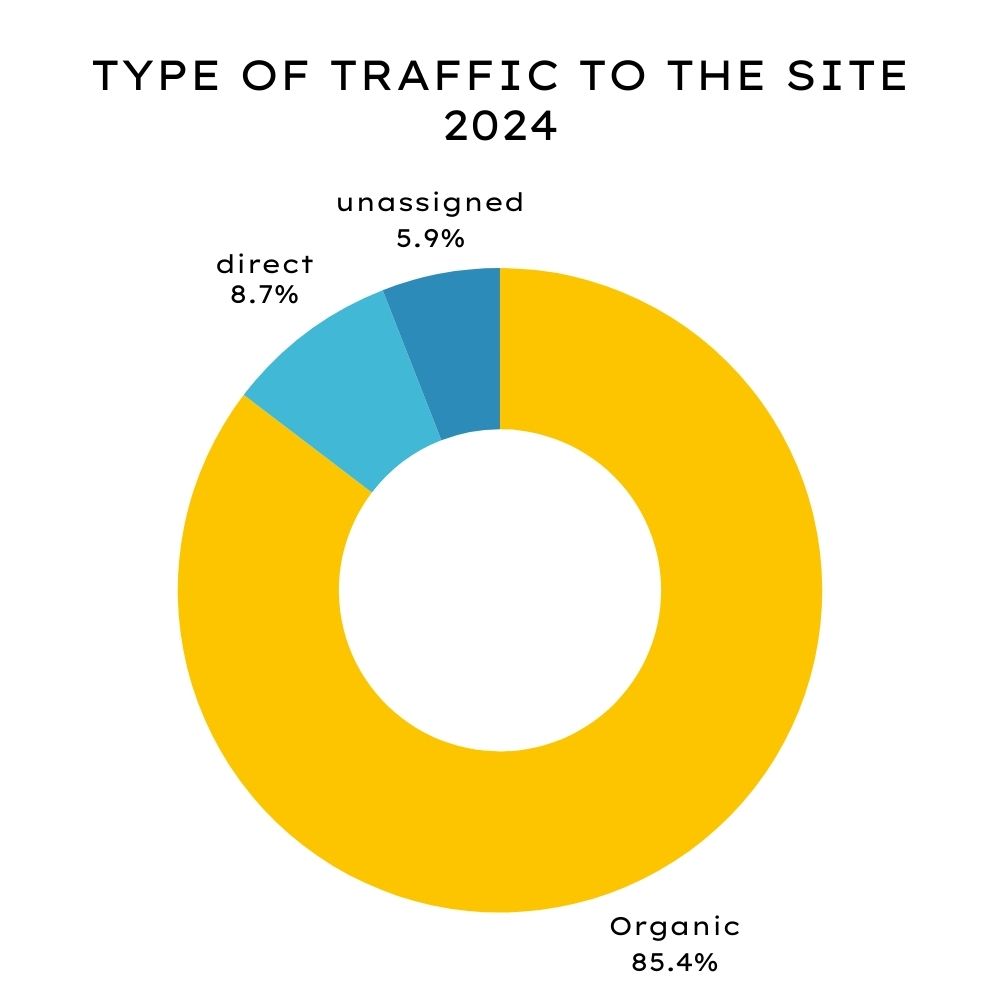
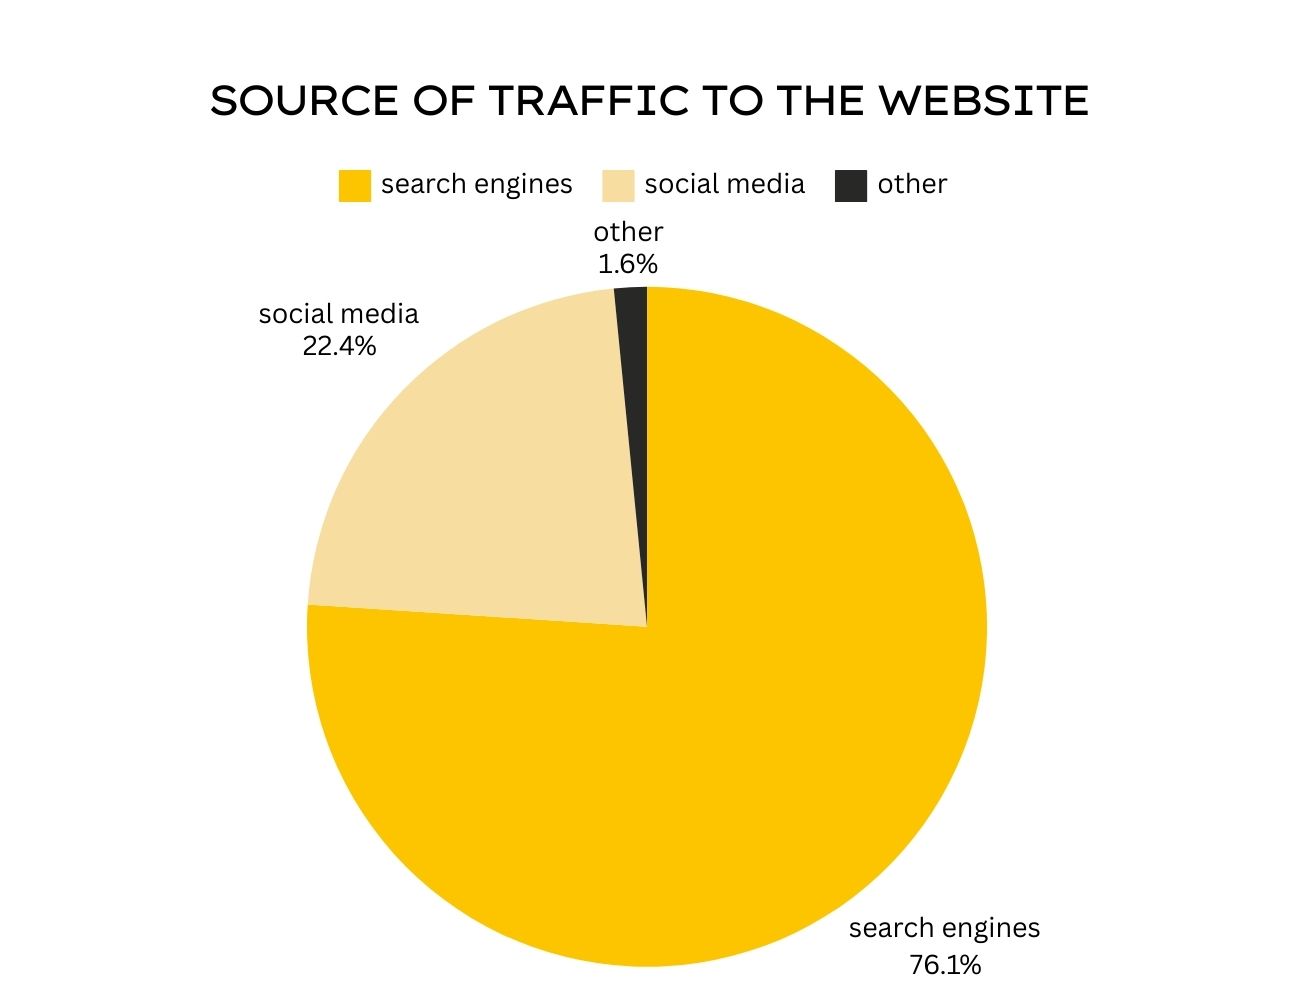
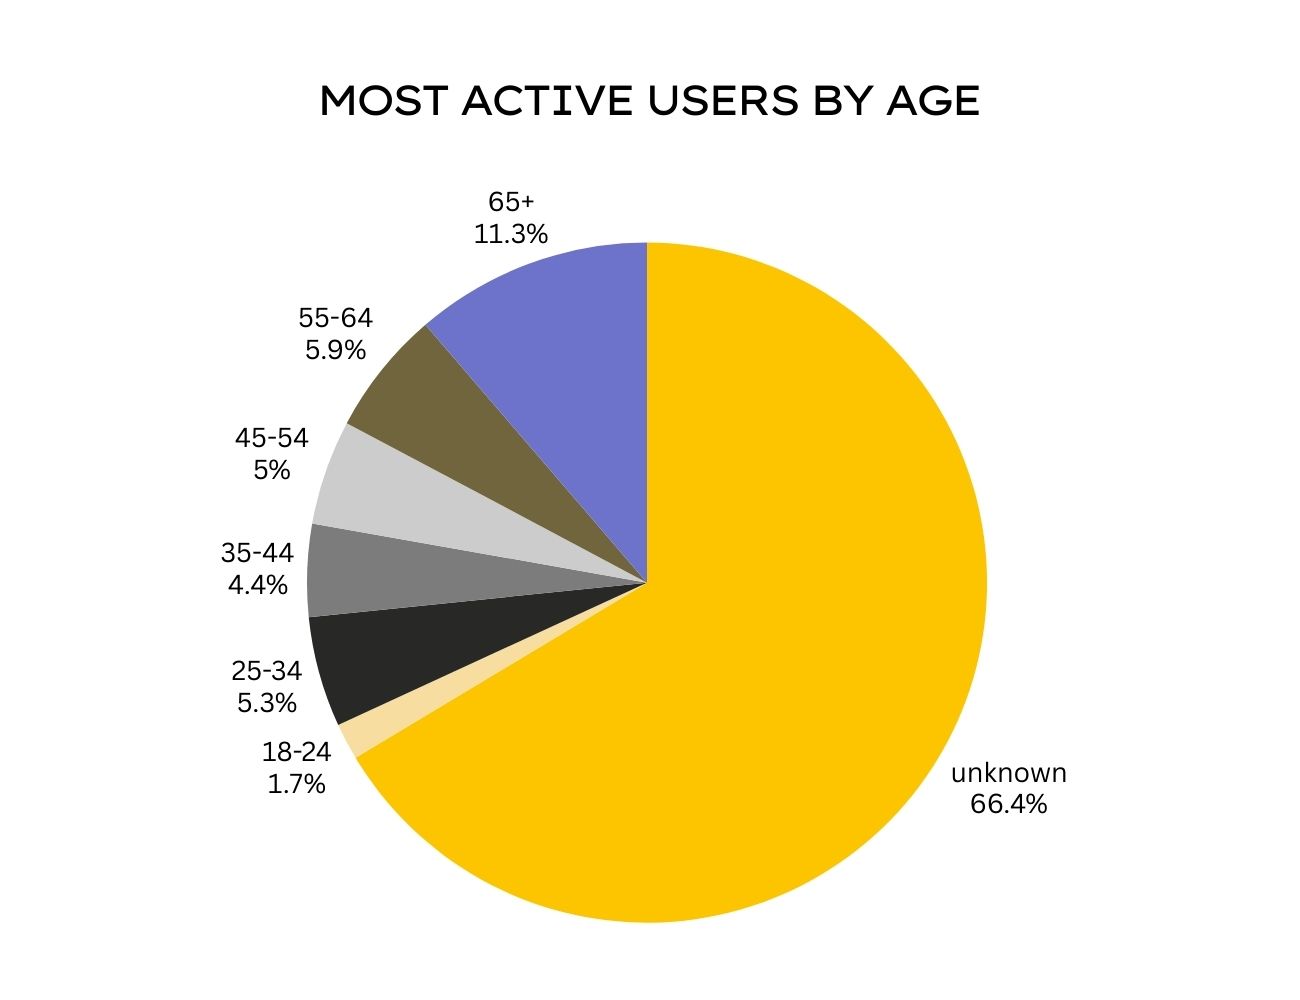
all below data is gathered from Google Analytics and the whole of 2025
📈 New Zealand Marketplace Statistics: 2025 Growth & Resilience
Despite a challenging economic climate, The Hive NZ community proved that local commerce is thriving.
41.3% Surge in Active Users: Our audience grew significantly in 2025, bringing thousands of new potential customers to our local vendors.
The December Record: We saw a 28.82% increase in sales year-on-year—amazingly, we hit this record within just the first 15 days of December.
- Our best month was November which saw an equally staggering 21.65% increase in sales compared to last year.
42% Increase in Engagement: Site “Events” (clicks and views) are up, showing that our users are highly active and motivated shoppers.
🧐 The "Numbers Game": Conversion Rates
Understanding Your Conversion Rates
In the New Zealand e-commerce market, an “underachieving” website typically sees a conversion rate between 0% and 2%. In contrast, the industry standard for a “good” NZ website usually sits between 2% and 3%. Furthermore, anything exceeding 5% is considered truly stellar.
The Hive NZ consistently performs within that healthy range. Specifically, our overall marketplace conversion rate for 2025 was 2.79%. Consequently, for every 100 visitors to your shop, you can realistically expect 2 to 3 completed sales.
The Industry Standard: A “good” NZ e-commerce website usually sits between 2% and 3%. Anything higher than 5% is considered truly stellar.
The Hive’s Performance: Our marketplace consistently maintains a healthy conversion rate within that 2–3% range. Our conversion rate for 2025 overall was 2.79%
What this means for you: For every 100 “eyes” on your shop, you can realistically expect 2 to 3 “buys.”
Pro Tip: Vendors who reach the higher end of these benchmarks are those who prioritize high-quality images, clear SEO (Search Engine Optimization), and transparent shipping info.
🔎 What are our shoppers looking for?
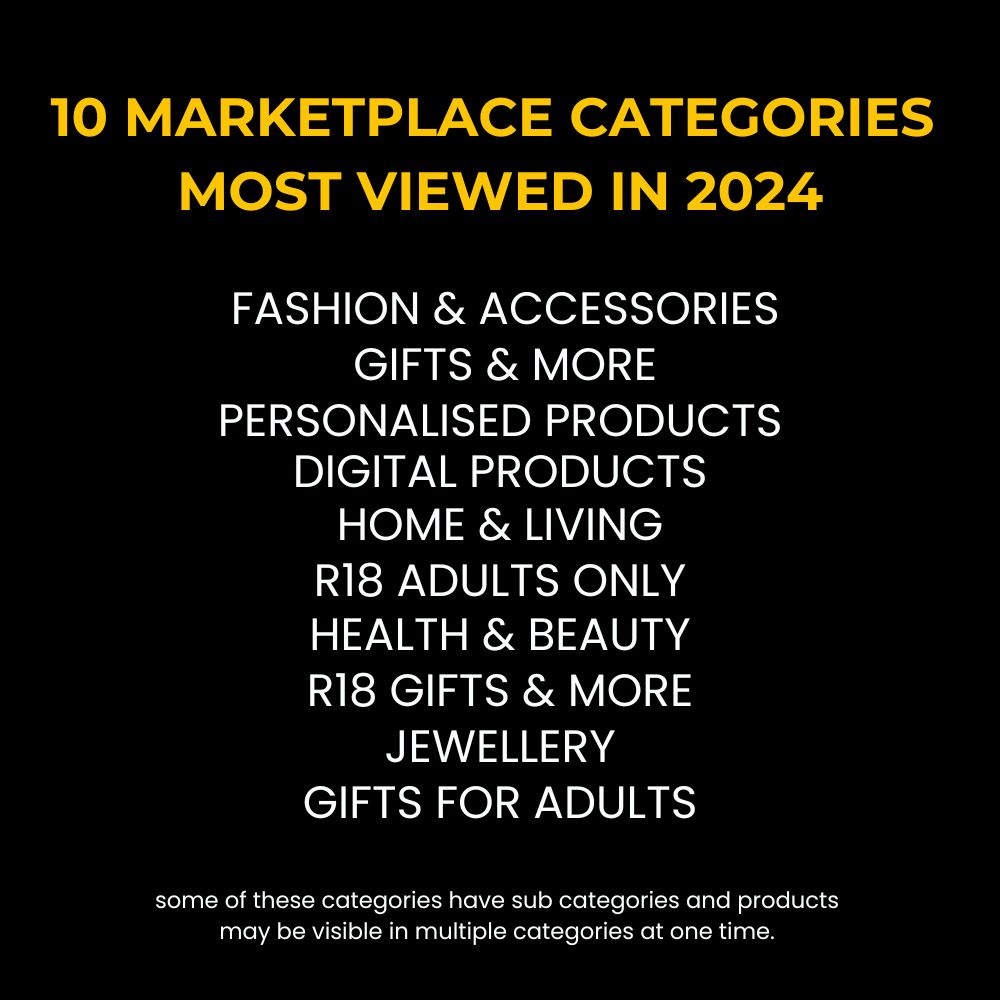
The Hive NZ ranks highly on Google for a massive variety of terms. Here are the top categories our 2025 audience explored:
Fashion & Accessories
Wholesale (High demand, low competition—a massive opportunity!)
Gifts & Personalised Products
Home & Living Decor
Health & Beauty
New Zealand Marketplace Statistics: Wholesale Trends
Note: Our Wholesale category is the #2 most viewed area of the site, yet it remains one of our least crowded categories. Adding wholesale pricing is one of the fastest ways to stand out.
Analysing Shopper Search Trends
Moreover, it is vital to understand what our shoppers are looking for. The Hive NZ ranks highly on Google for a massive variety of terms. In particular, our 2025 audience explored categories like Fashion and Personalised Gifts.
Most importantly, our Wholesale category is the second most viewed area. However, it remains one of our least crowded categories. Therefore, adding wholesale pricing is one of the fastest ways to stand out on the platform.
How to Improve Your Shop Performance
Additionally, our data shows that certain factors drive higher results. For example, vendors who reach the top end of these benchmarks prioritise three specific areas. First, they use high-quality images. Second, they implement clear SEO. Finally, they provide transparent shipping information.
As a result, focusing on these elements will help you maximise your reach within our New Zealand marketplace statistics.
2024 STATISTICS