2026
The below information is for the period 1 January 2026 – 30 September 2026.
Transparency is at the heart of The Hive NZ. If you want to sell online in NZ and need reliable data, this guide looks at how our multi-vendor marketplace performs against wider e-commerce standards—keeping things simple, clear, and jargon-free.
1. Search Performance: How Shoppers Find Us
When people search for products online, how often do they click on our links? Two key metrics tell this story:
- Click-Through Rate (CTR): This measures the percentage of people who see our link on a Google search page and actually click through to visit the site. Our 2.8% rate means we are well above the standard market average (which usually sits between 1.4% and 2.0%). People are finding what our vendors offer genuinely appealing.
- Average Search Position (18.8): This tracks where our pages generally land in Google search results when people type in text.
- What it means & how it’s calculated: This is the average placement of our web pages across Google search results (where position 1 is the very top result on the first page). Because search results feature multiple listings per page, an average position of 18.8 means our pages consistently appear on the first and second pages of Google when shoppers look for unique local goods.
- How we rank compared to New Zealand E-Commerce: Across New Zealand retail and general e-commerce websites, average text rankings often fluctuate widely across thousands of competitive product keywords. Landing an average position of 18.8 places The Hive NZ strongly within the top two pages of Google search results for our core terms, outperforming many standard niche local stores that struggle to break past page three or four.
2. The Power of Visual Search
Shoppers don’t just type words into search bars anymore—many use photos or image search tools like Google Lens to find items.
- What is Visual Search? It is when a shopper uses a picture to find a matching product online.
- Our Visual Performance & Position (1.8): Our vendors’ product photos perform exceptionally well here, landing an average visual search position of 1.8 with a healthy 1.2% click-through rate.
- What it means & how it’s calculated: This calculates the average row and column placement where our images appear in Google’s visual discovery grid. An average position of 1.8 means our vendor photos regularly rank at the absolute top of image search results, making it effortless for visual shoppers to discover products on The Hive.
- How we rank compared to New Zealand E-Commerce: Visual search optimization is a newer frontier for New Zealand e-commerce. While many local competitors are still building out image indexing, our average position of 1.8 puts us right at the absolute vanguard of visual discovery in New Zealand retail, capturing high-intent shoppers instantly through Google Lens and image search.
3. The Shopping Funnel: From Browsing to Checkout
To truly understand how customers move through the marketplace, we track key steps as they step closer to a purchase:
- Users Who Add to Cart (24.01%): This measures the percentage of visitors who find something they love and add at least one item to their shopping cart.
- How we compare in NZ: Across New Zealand e-commerce sites, standard add-to-cart rates typically sit around 8% to 15%. Hitting 24.01% is exceptionally strong, proving that our vendor product selections and catalog appeal heavily to arriving shoppers compared to average local stores.
- Users Who Go From Cart to Checkout (3.62%): This tracks the percentage of visitors who move past their virtual cart and actively click through to the final checkout stage.
- How we compare in NZ: While many local multi-vendor sites experience high cart abandonment before checkout due to shoppers hopping between independent vendor stores, our rate shows steady progression through the buying journey.
- Checkout to Pay (54%): This is a critical milestone measuring how many shoppers who reach the payment step successfully complete their transaction.
- How we compare in NZ: Industry benchmarks for final payment completion in New Zealand often hover around 40% to 50% due to payment friction or shipping surprise costs. A 54% success rate shows that our checkout process is smoother, more trustworthy, and easier to finish than many competing platforms.
- Overall Conversion Rate (1.97%): This is the final percentage of total visits that result in a completed purchase for January to September 2026. In the online shopping world, a conversion rate sitting around 2% is considered a healthy, solid performance.
4. How We Stack Up in E-commerce and Local Marketplaces
It is always helpful to look at the bigger picture and see how marketplace shopping in New Zealand compares to both global standards and local alternatives.
- Global E-Commerce Standards: Standard online stores and marketplaces generally see conversion rates hover between 1.8% and 3.0%. The Hive NZ sits comfortably right in that sweet spot.
- Local Marketplace Context (Felt, Chooice, and Buy Kiwi): Platforms that feature multiple independent local creators all share a unique challenge: customers love to browse widely across many different vendor stores before buying. Because a huge portion of our visitors arrive through organic Google searches with a strong intent to purchase, our conversion efficiency and checkout completion rates hold their own right alongside New Zealand’s established e-commerce benchmarks.
MORE INFORMATION COMING FOR 2026 – AT THE START OF 2027
2025
Reviewing the latest New Zealand marketplace statistics is essential for any local vendor. These insights and conversion rates help you decide how your business fits into our ecosystem. Use this data to position your products for maximum success on The Hive NZ.
Vendor Success Disclaimer:
As important as these insights are, we must be clear: our data reflects The Hive NZ as a whole. With hundreds of vendors selling a vast range of goods and services, we cannot guarantee individual results. Your results as an online vendor will vary based on your product niche, your specific business goals, and the quality of your work.

The “PRO+ Boost” Advantage
We can wholeheartedly say our vendors on the PRO+ Boost plan see significantly better results in their conversion rates and audience reach compared to our Pro or our free plan. These vendors receive priority visibility and generally invest more energy into mastering our E-commerce marketplace tools.
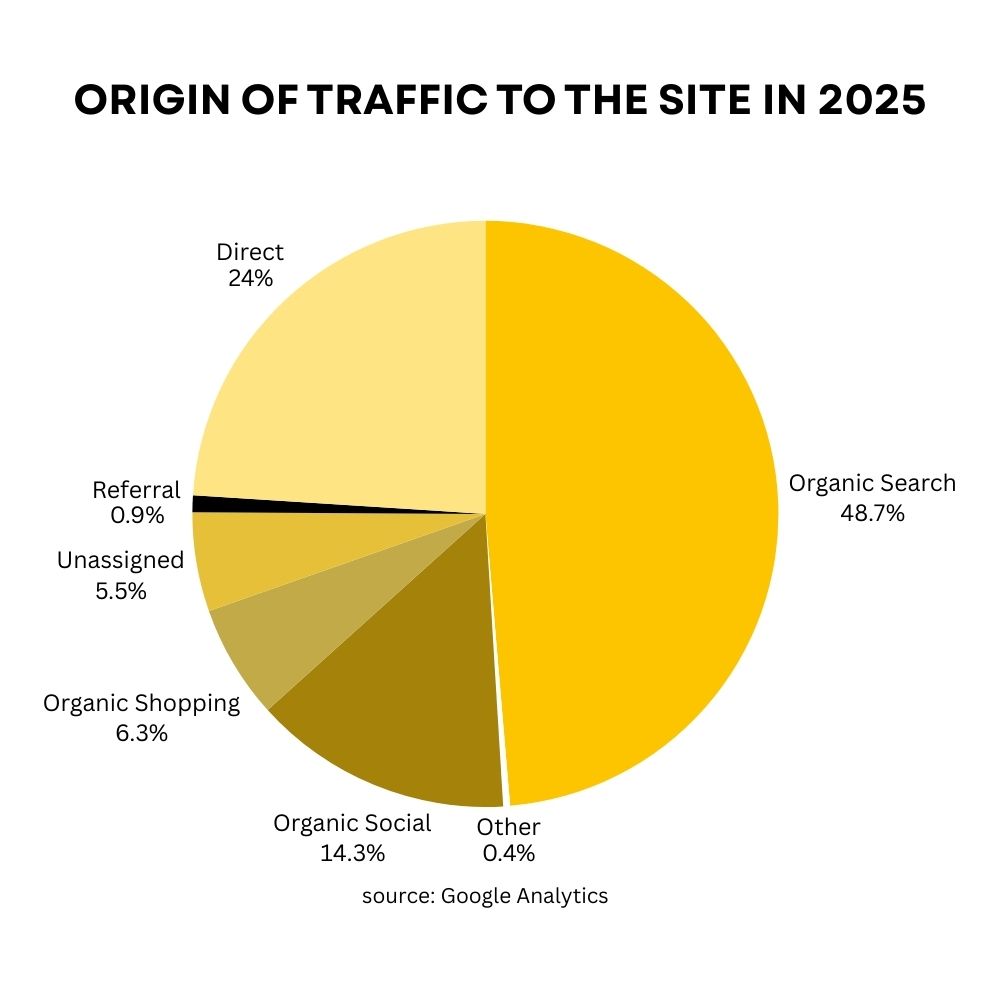
all below data is gathered from Google Analytics and the whole of 2025
New Zealand Marketplace Statistics: 2025 Growth & Resilience
Despite a challenging economic climate, The Hive NZ community proved that local commerce is thriving.
- 41.3% Surge in Active Users: Our audience grew significantly in 2025, bringing thousands of new potential customers to our local vendors.
- The December Record: We saw a 28.82% increase in sales year-on-year—amazingly, we hit this record within just the first 15 days of December.
- Our best month was November which saw an equally staggering 21.65% increase in sales compared to last year.
- 42% Increase in Engagement: Site “Events” (clicks and views) are up, showing that our users are highly active and motivated shoppers.
The “Numbers Game”: Conversion Rates
Understanding Your Conversion Rates
In the New Zealand e-commerce market, an “underachieving” website typically sees a conversion rate between 0% and 2%. In contrast, the industry standard for a “good” NZ website usually sits between 2% and 3%. Furthermore, anything exceeding 5% is considered truly stellar.
The Hive NZ consistently performs within that healthy range. Specifically, our overall marketplace conversion rate for 2025 was 2.79%. Consequently, for every 100 visitors to your shop, you can realistically expect 2 to 3 completed sales.
- The Industry Standard: A “good” NZ e-commerce website usually sits between 2% and 3%. Anything higher than 5% is considered truly stellar.
- The Hive’s Performance: Our marketplace consistently maintains a healthy conversion rate within that 2–3% range. Our conversion rate for 2025 overall was 2.79%
- What this means for you: For every 100 “eyes” on your shop, you can realistically expect 2 to 3 “buys.”
Pro Tip: Vendors who reach the higher end of these benchmarks are those who prioritize high-quality images, clear SEOSEODefinition SEO= Search Engine Optimisation. It is the practice of improving a webpage to help it rank higher in search engine results. The goal is to bring in more free, organic traffic from people searching online. Explanation Imagine a massive library with millions of books, and you need to find one specific recipe. A librarian helps you by organising the shelves and pointing you straight to the best book. Search engines like Google work in a similar way. When you use SEO, you are arranging your online shop and product pages so search engines easily understand them. This helps your brand show up near the top of the results when customers search for what you sell, making it much easier for buyers to find you without paying for adverts. (Search Engine Optimization), and transparent shipping info.
What are our shoppers looking for?
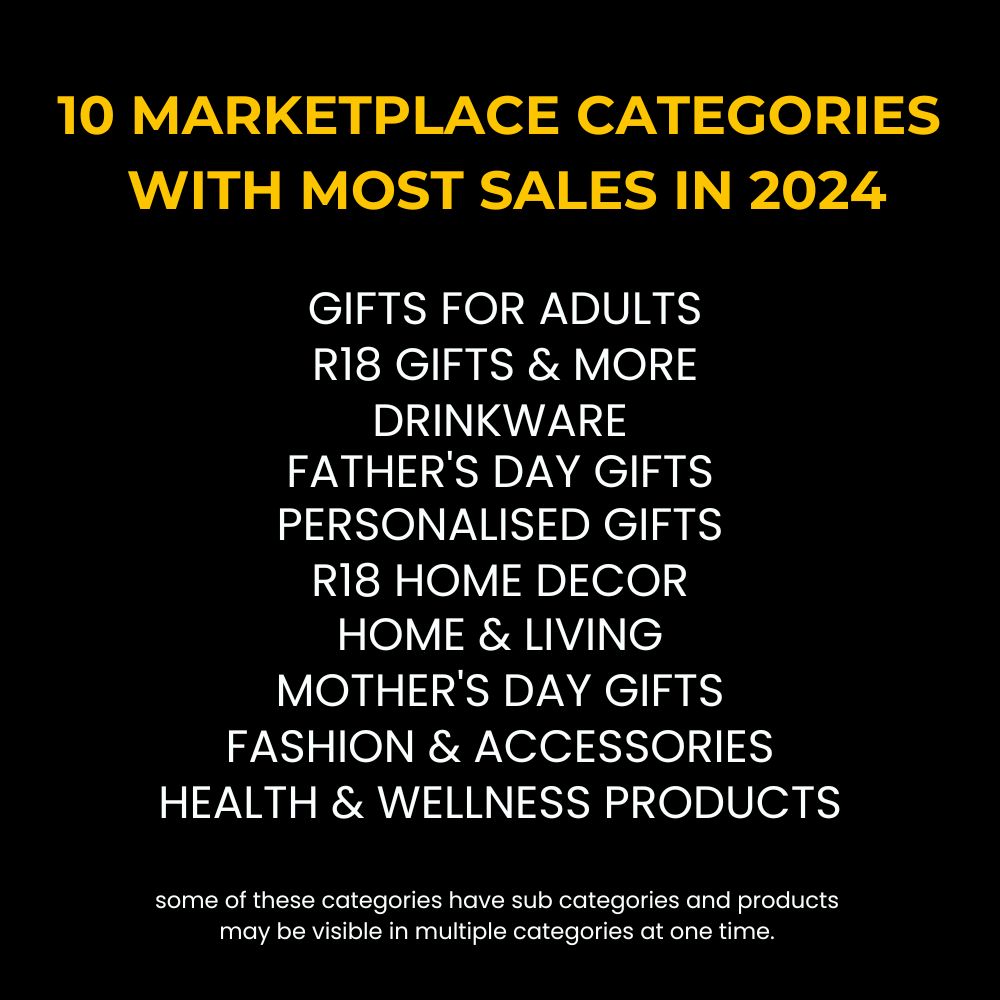
The Hive NZ ranks highly on Google for a massive variety of terms. Here are the top categories our 2025 audience explored:
- Fashion & Accessories
- Wholesale (High demand, low competition—a massive opportunity!)
- Gifts & Personalised Products
- Home & Living Decor
- Health & Beauty
New Zealand Marketplace Statistics: Wholesale Trends
Note: Our Wholesale category is the #2 most viewed area of the site, yet it remains one of our least crowded categories. Adding wholesale pricing is one of the fastest ways to stand out.

Analysing Shopper Search Trends
Moreover, it is vital to understand what our shoppers are looking for. The Hive NZ ranks highly on Google for a massive variety of terms. In particular, our 2025 audience explored categories like Fashion and Personalised Gifts.
Most importantly, our Wholesale category is the second most viewed area. However, it remains one of our least crowded categories. Therefore, adding wholesale pricing is one of the fastest ways to stand out on the platform.
How to Improve Your Shop Performance
Additionally, our data shows that certain factors drive higher results. For example, vendors who reach the top end of these benchmarks prioritise three specific areas. First, they use high-quality images. Second, they implement clear SEO. Finally, they provide transparent shipping information.
As a result, focusing on these elements will help you maximise your reach within our New Zealand marketplace statistics
2024
As for many other businesses, 2024 was a tough year for our business as well; it was time to batten down the hatches and ride out a storm we’re still all in the middle of!
Very Lucky
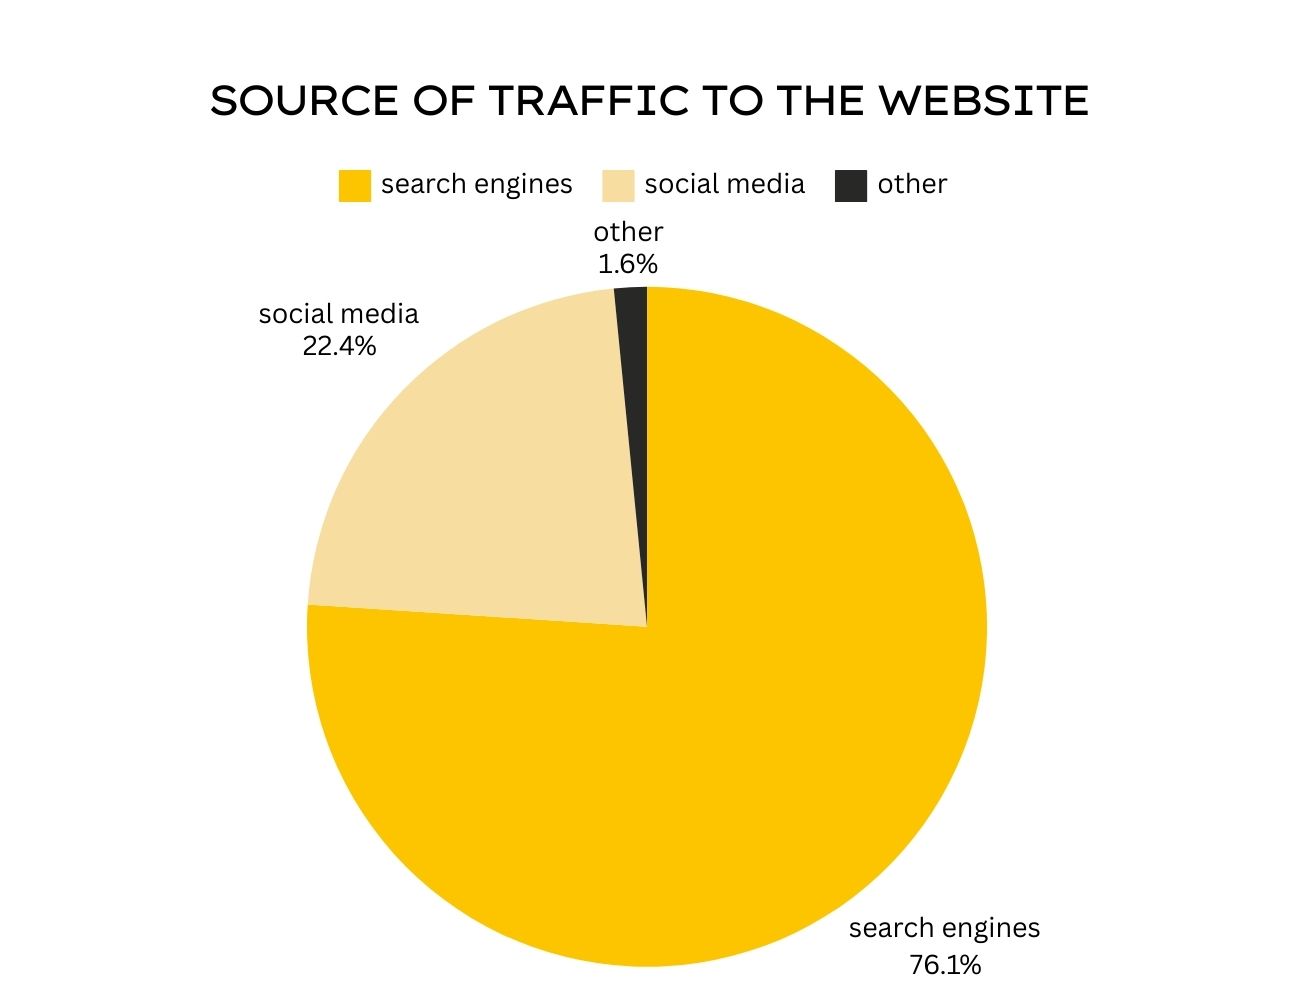
To say we feel very lucky to have made it through so far AND still have some pretty good results, considering, is an understatement. Our focus has always been on organic traffic and reaching our ideal audience without a heavy focus on ads.
Analysing Our Audience Reach
This year this became even more important. Which meant more work was put in attracting our audience through work on SEO*. Also, educating our vendors on how to maximise their potential on their store pages as well as with their products.

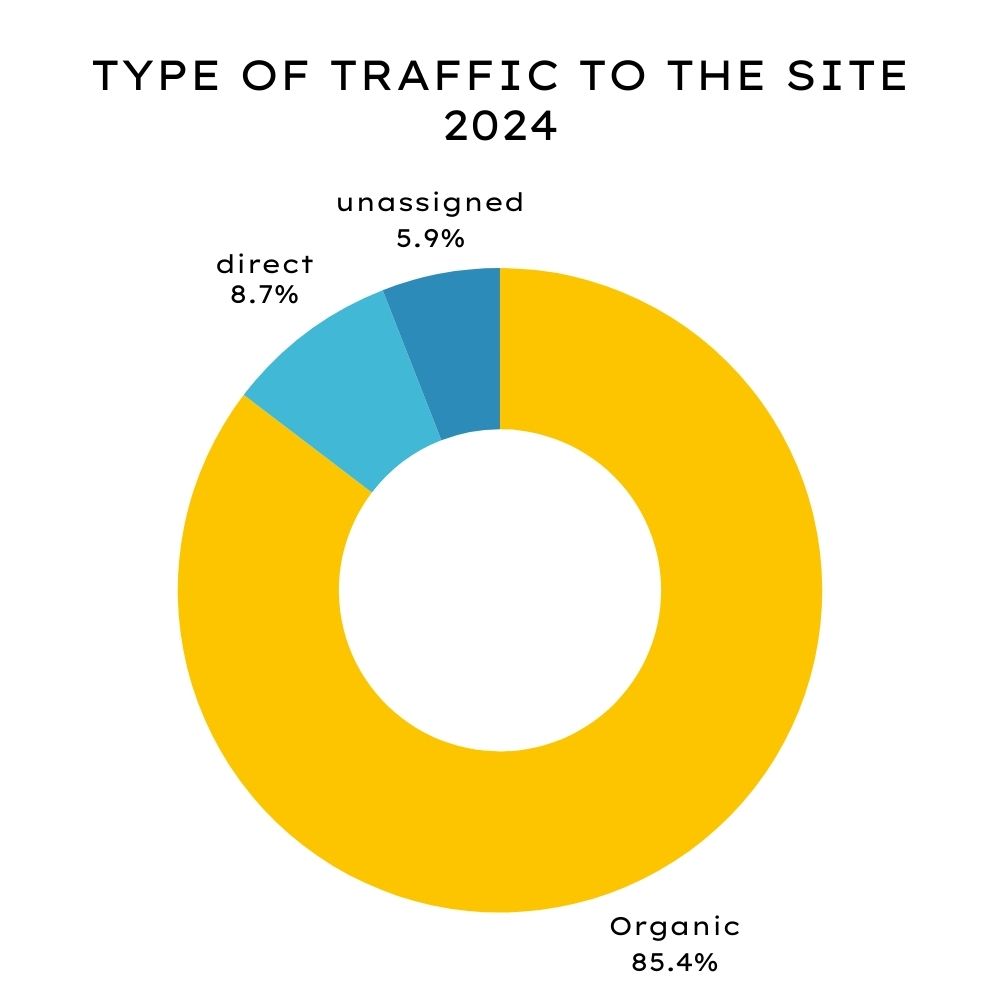
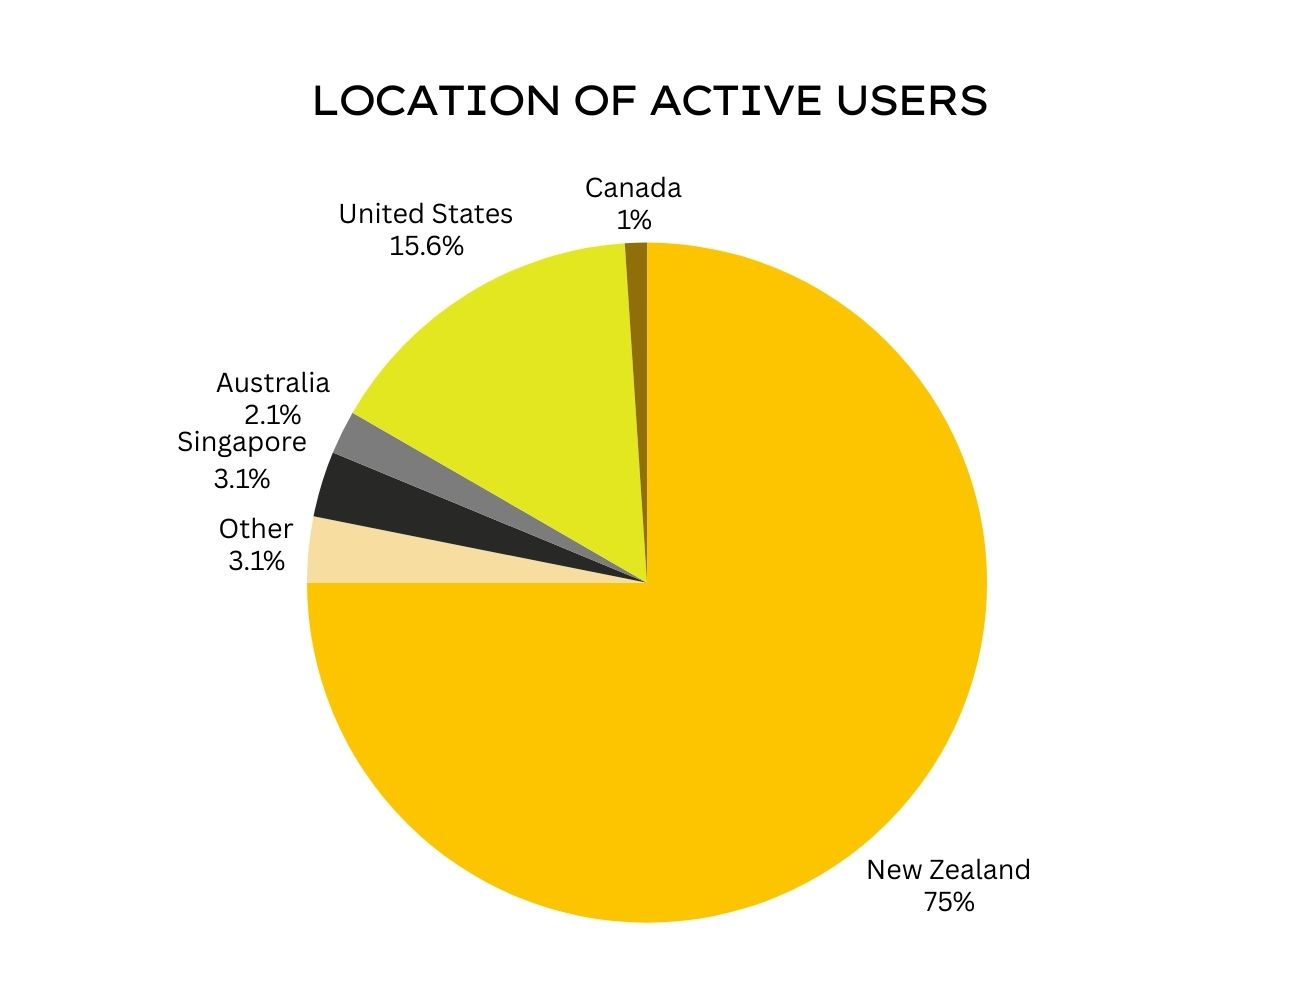
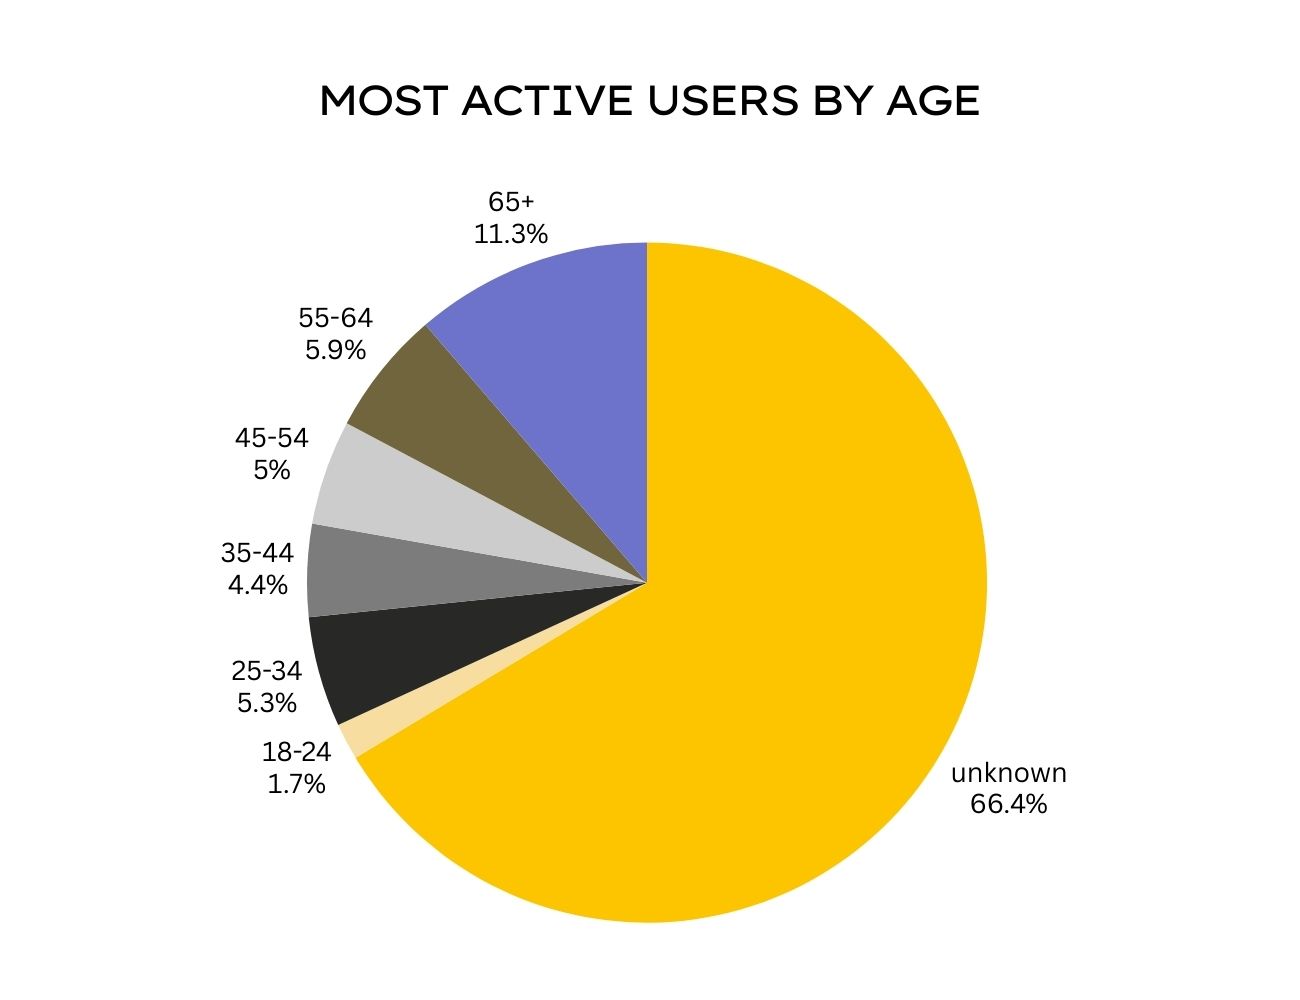
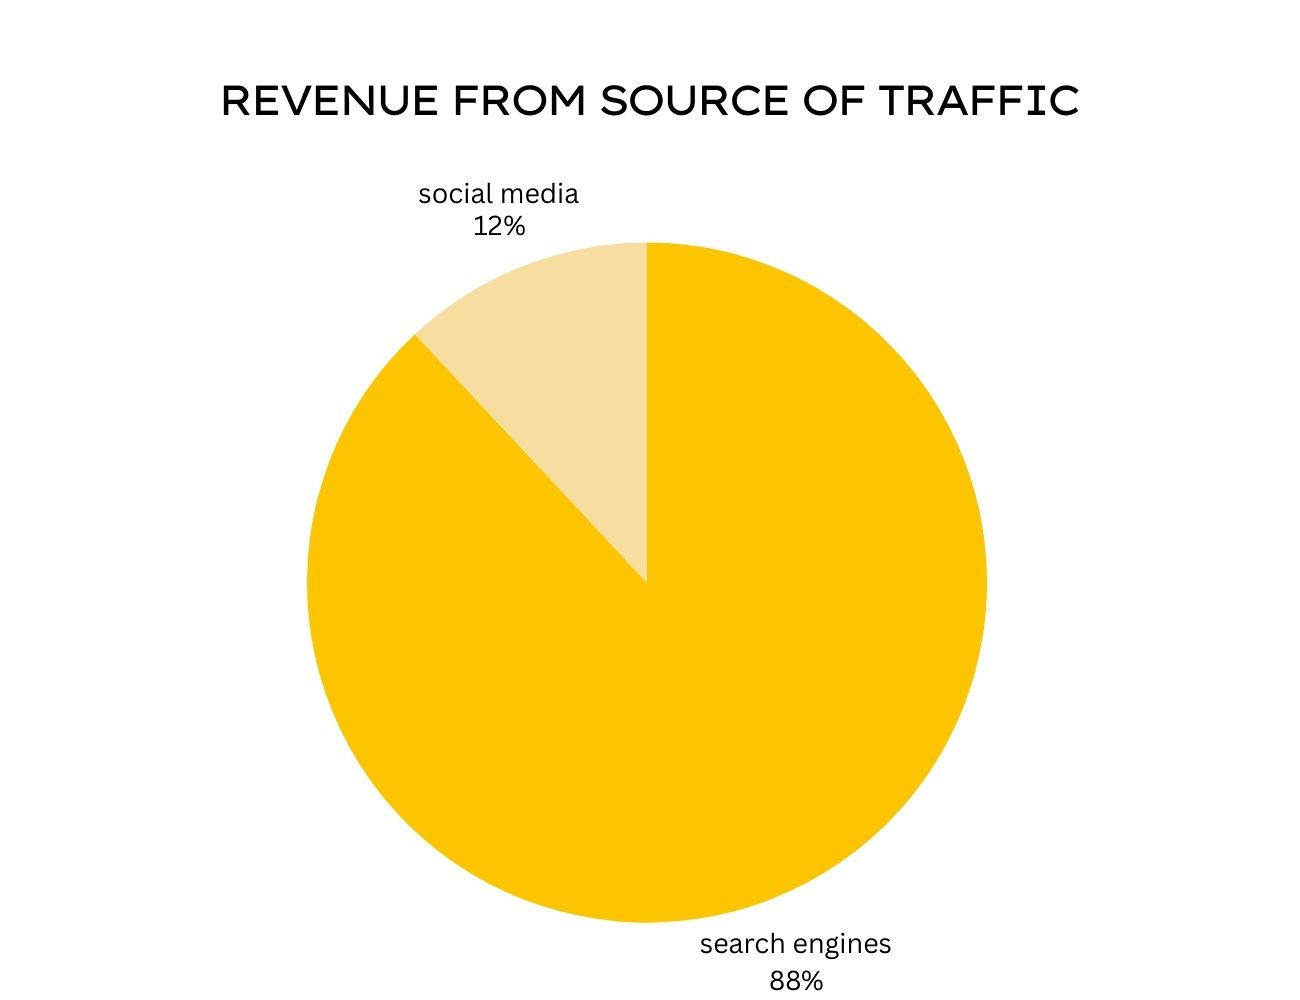
Let’s talk about our audience (our most active users) first; how they arrive on our marketplace, where they live, their age and also who’s buying..